Reports provide insightful information about a navigation program including patient volumes, timeliness to care, productivity, and performance with other metrics and standards. Those reports further delineate whether a navigation program is performing as expected or needing improvement. OncoNav provides several methods of reporting to help demonstrate the navigation program’s effectiveness. These include pre-built navigation program reports in Reports Plus and more specific user-defined reports in Ad Hoc reporting. We’ll focus on the pre-built reports here.
Reports Plus
OncoNav’s Reports Plus module contains several pre-built reports that can readily demonstrate navigation program effectiveness and productivity. Reports available here include summary and detailed views for information about patient volumes by navigator, disease type, and acuity levels; barriers and interventions; time spent by navigator; and more based on a user-defined date range. Additional parameters may provide the ability to view data for a specific facility, disease type, or navigator.
Reporting for Program Review
Reports Plus is a great way to quickly view an overview of an organization’s navigation program. One such overview report is the Navigation Scorecard. This report displays information on 11 reports for the last 4 years, quarters, months, or weeks to better trend the navigation program. This comprehensive report displays data and graphs for new patient volumes by navigator and by disease type, top barriers and interventions, referrals to the navigation program, resources provided to the patient, and distress screening completed.
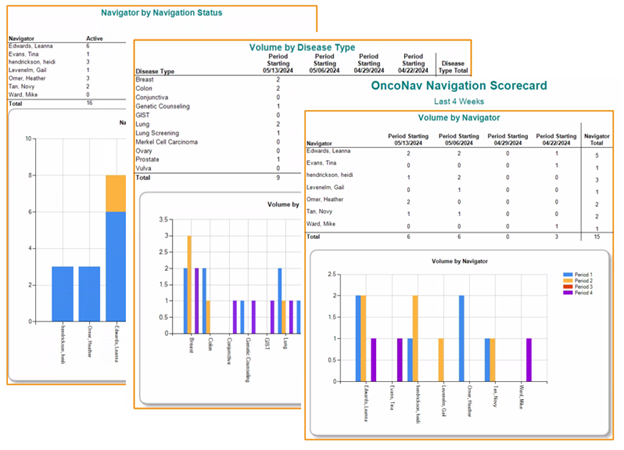
Navigation Scorecard Report Sample
OncoNav’s Lung Screening Statistics report gives information specific to an organization’s lung screening program. This report displays a breakdown of information based on the lung screening procedure documented to include the low-dose CT exam, follow up imaging, and follow up tissue sampling. The data that can be reported here include the number of baseline versus annual exams completed, lung-RADS results for these exams, any procedures that resulted in a lung cancer diagnosis, and the histology and stage of that cancer.
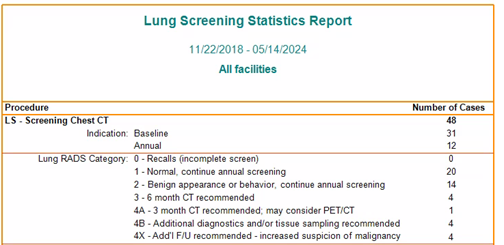
Lung Screening Statistics Report Sample
Reporting for Accreditations
In addition to reporting to demonstrate navigation program effectiveness, some reports in Reports Plus may provide data specific to show navigation’s support of accreditations such as Commission on Cancer (CoC), National Accreditation Program for Breast Centers (NAPBC), and Quality Oncology Practice Initiative (QOPI). The Barriers to Care Detail Report, for example, displays information about the barriers encountered and the interventions provided to help overcome them. This report provides information needed for CoC standard 8.1 Addressing Barriers to Care, NAPBC standard 5.7 Comprehensive Evaluation of Patient Factors Before Treatment, and QOPI standard 1.2.7 where an initial psychosocial assessment is completed, and interventions are provided.
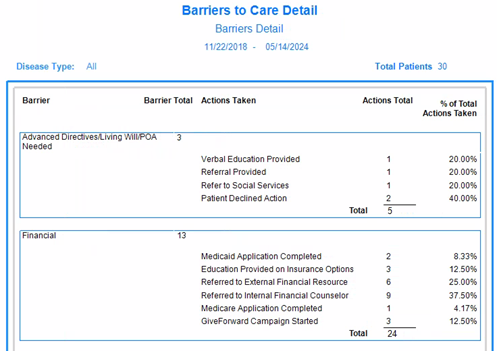
Barriers Report Sample
Reporting for Productivity
Several reports in Reports Plus provide data about navigator productivity. The Navigation Scorecard, as discussed previously, displays new patient volumes by navigator and by disease type. There is also a breakdown with the average number of barriers for a patient with a specific disease type which can increase acuity and the number of encounters but may reduce the patient caseload for that navigator. Additionally, the Time Spent reports allow administrators to easily visualize how much time the navigation team is spending on tasks for patient care.
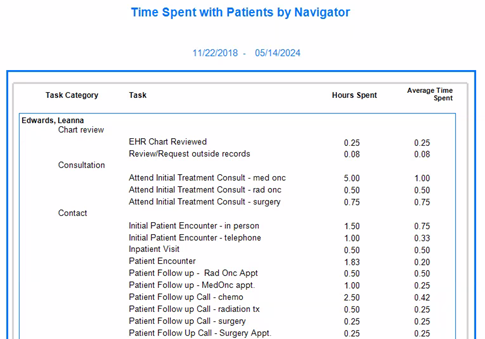
Time Spent Report Sample
Reporting for Quality Metrics
The Academy of Oncology Nurse and Patient Navigators (AONN+) began working in 2017 on creating a group of quality metrics to assist in standardizing documentation for navigation. Currently, required documentation is most often driven by cancer program administrators or navigation program managers. Documentation can differ from program to program, facility to facility, and even navigator to navigator. With the implementation of the quality metrics, AONN+ hopes to move towards more consistent data collection within navigation programs. They developed 35 evidence-based navigation metrics that would help to standardize navigation documentation and provide a guide to reporting to evaluate navigation program effectiveness. The AONN Metrics Report in Reports Plus demonstrates how an organization’s navigation program is meeting any of those metrics they are tracking and allows the navigation program to follow a trend on how well they are doing.
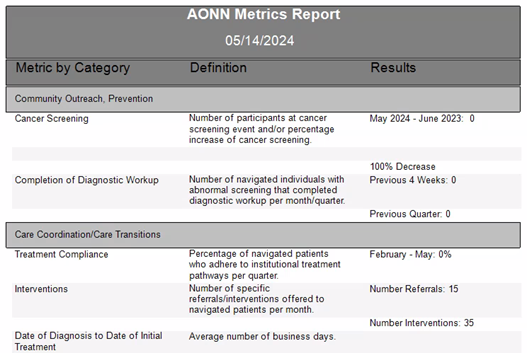
AONN Metric Report Sample
Quality Assurance
Many of the reports included in the Reports Plus module have attached Quality Assurance reports. These reports provide additional information about the patients included in the report. They may also show patients who may have been omitted from the report and why. The Quality Assurance reports break down the errors leading to omitted patients in separate tabs that provide the list of those patients with the ability to open the patient directly from the report for editing necessary data. Once the patient data is corrected, the report can be reloaded to ensure that every patient who should be included in the report is included and to allow for accuracy and completion of the data included in that report.
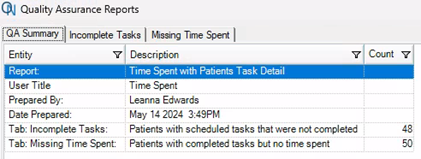
Quality Assurance Reports Sample
Thank you for taking the time to read more about the pre-built reports in Reports Plus. For more information about this and other reporting options available in OncoNav, please reach out to us at support@onco-nav.com. If you’re not a current client and would like to see a demo, please email us at sales@oncolog.com or click the link Schedule a Demo from the Onco website.

Oncology Data Management Software That Makes a Difference.
Enhance workflows while delivering quality information.